

After decades of technological advancement, troubleshooting still feels remarkably primitive
Modern computers can generate realistic images, translate languages instantly, predict equipment failures, recognize faces, and analyze billions of events in seconds.
Yet when a Windows server begins exhausting network resources, an application starts dropping packets, or a firewall queue approaches capacity, the person responsible for fixing it may receive little more than a vague timeout, a disconnected session, or an unexplained performance complaint.
The information required to identify the problem is often available somewhere. It may be hidden in a performance counter, buried in an event log, exposed through a PowerShell command, captured in a packet trace, or visible inside a vendor-specific diagnostic tool.
But the system rarely puts those pieces together and simply says, “network resource pressure is increasing. UDP packets are being delayed or dropped. This is affecting SNMP polling and may also be disrupting applications that rely on UDP transport.”
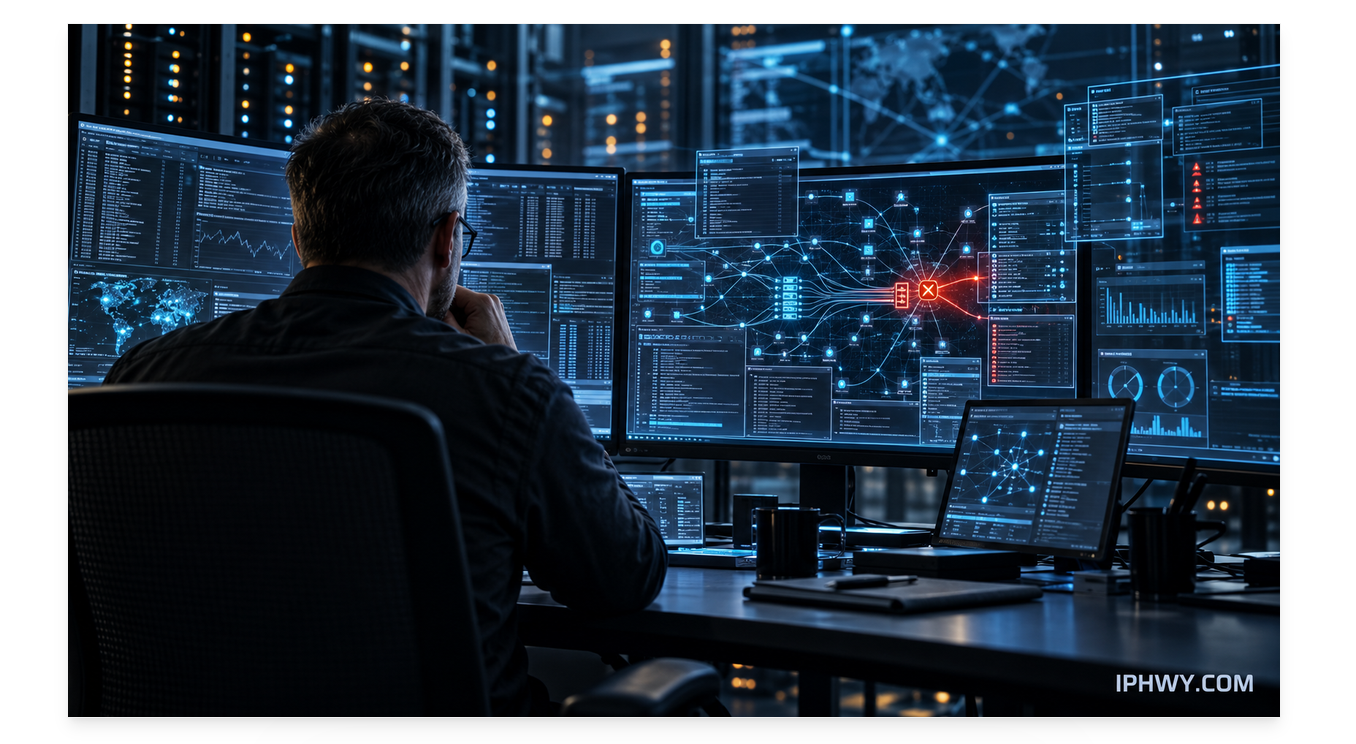
Instead, the administrator becomes an investigator, and that feels increasingly absurd.
We Have Better Technology, but Not a Better Troubleshooting Experience
The Windows Task Manager introduced in the 1990s and the version available today look dramatically different. Modern versions display processors, memory, disks, network utilization, startup applications, services, and GPU activity.
That is useful… but it primarily shows the resources that are easiest to understand.
CPU is at 95 percent. Memory is nearly full. A disk is busy. An application is consuming bandwidth.
Those are the obvious problems.
What Task Manager does not explain nearly as well are the less visible conditions that frequently cause serious outages–>
- Ephemeral port exhaustion
- Excessive connections in TIME_WAIT
- UDP receive errors
- Packet drops and retransmissions
- Socket or network buffer pressure
- Nonpaged memory pool exhaustion
- Application connection leaks
- DNS resolution delays
- Storage latency hidden behind normal utilization
- Firewall session-table pressure
- Switch queue congestion
- Authentication and certificate-chain failures
The operating system often knows that these conditions are occurring. It maintains the counters, connection tables, error statistics, and event data needed to detect them.
The problem is not always a lack of telemetry. The problem is that the telemetry is fragmented, poorly presented, and rarely translated into something actionable.
Troubleshooting by Scavenger Hunt
Consider a situation in which network buffers begin filling somewhere along a traffic path.
At first, users may report that Remote Desktop sessions are unstable. A monitoring system may begin recording late SNMP responses. Devices may appear to go down and then recover seconds later. An application may generate intermittent timeout errors.
Each symptom appears to be a separate problem. The server team investigates Remote Desktop. The monitoring team investigates the polling application. The network team checks switches and firewalls. The application team reviews its logs.
CPU may look normal. Memory may look normal. Network bandwidth may not appear saturated.
Nothing on the standard dashboard says, “This is one underlying network-resource problem affecting several services.”
Only after comparing firewall behavior, switch statistics, operating-system counters, protocol behavior, and timestamps does the actual pattern emerge.
Perhaps UDP packets are being delayed or dropped as buffers fill. That could explain why SNMP responses arrive late and why Remote Desktop works better after being forced to use TCP instead of UDP.
Once understood, the relationship makes sense.
Discovering it, however, may require shell commands, packet captures, performance counters, registry changes, vendor logs, and hours of human correlation.
IMO, that is not an effective diagnostic experience given the technology available today. It’s a scavenger hunt.
Monitoring Is Not the Same as Understanding
The technology industry has become very good at collecting data.
Servers, endpoints, cloud platforms, firewalls, switches, applications, and security products can produce enormous volumes of logs and metrics. Organizations invest heavily in monitoring, observability, SIEM, application performance management, and network management platforms.
But collecting more data does not automatically create understanding. A dashboard containing 200 graphs may provide visibility while still failing to provide an answer.
This distinction is important–>
- Monitoring tells us that something changed.
- Observability gives us evidence about what the system is doing.
- Diagnosis explains why it is happening.
- Guidance tells us what to investigate or do next.
Most products perform the first function reasonably well. Some provide the second. Far fewer reliably provide the third and fourth.
Consequently, vendors can claim that all the necessary information was available, even though it was scattered across five interfaces and required an experienced engineer to recognize the connection.
Technically available is not the same as operationally useful.
Why Hasn’t This Improved?
Part of the difficulty is that modern technology environments are extraordinarily complex.
Windows understands what is happening within the operating system, but it does not necessarily know what is occurring on a firewall, hypervisor, switch, storage array, or upstream network. Each vendor sees its own portion of the problem.
Symptoms also appear far from their causes.
A full firewall buffer may present itself as an application timeout. Storage latency may resemble a database problem. DNS delays may make an application appear slow. Packet loss may cause monitoring systems to report that otherwise healthy devices are unavailable.
Thresholds present another challenge. Ten thousand connections may be normal for one server and dangerous for another. A brief burst of packet loss may be harmless in one environment but damaging in another.
These are legitimate engineering complications. But they do not fully justify the current experience.
Modern systems already establish performance baselines, identify behavioral anomalies, correlate security events, and analyze enormous datasets. The industry has developed machine learning systems capable of identifying malware and generating human language.
Surely it is also possible to warn an administrator that ephemeral ports are approaching exhaustion or that UDP errors increased at the same moment multiple services became unstable.
What Diagnostics Should Look Like
An effective operating system or management platform should not require every administrator to remember obscure commands or manually interpret dozens of counters.
It should provide clear, contextual warnings such as…
Network resource pressure detected UDP receive errors increased 1,240 percent during the past 15 minutes. Packet loss coincides with SNMP polling delays and Remote Desktop transport failures. No corresponding CPU, memory, or bandwidth saturation was detected. Investigate host networking, firewall buffers, and upstream switch queues.
Or:
Dynamic port capacity warning The server has consumed 92 percent of its available ephemeral TCP ports. The largest source of connection growth is Application X. At the current rate, new outbound connections may begin failing within approximately 20 minutes.
This would not eliminate the need for experienced engineers. Nor should it automatically make configuration changes without authorization.
It would simply present the evidence in a way that respects the administrator’s time.
A physician still needs expertise even when diagnostic equipment highlights an abnormality. An airline pilot still needs training even when an aircraft issues a clear warning. Better instrumentation does not eliminate professionals-it helps them make faster and better decisions.
AI Should Reduce the Detective Work
Artificial intelligence is often presented as a way to generate content, automate jobs, or create conversational interfaces.
One of its most practical uses may be far less glamorous: making computers better at explaining themselves.
An intelligent diagnostic system could continuously establish normal operating patterns and correlate information across…
- Operating-system counters
- Network connections
- Event logs
- Application errors
- DNS performance
- Authentication events
- Firewall statistics
- Virtualization platforms
- Storage latency
- Monitoring alerts
Instead of showing twenty simultaneous warnings, it could identify that eighteen are probably downstream effects of the same condition.
It could explain its reasoning, show the supporting evidence, communicate its confidence level, and recommend the next diagnostic step.
Most importantly, it could distinguish between a symptom and a probable cause.
That would be a meaningful advancement-not because it replaces the administrator, but because it allows the administrator to spend less time finding the evidence and more time evaluating and correcting the problem.
The Information Was There All Along
Anyone who has spent years troubleshooting technology knows the familiar conclusion that comes after a difficult incident:
The evidence was there…
It was in the logs. It was visible in a counter. It appeared in a packet capture. A warning was recorded somewhere. A command could have displayed it.
But nobody knew where to look until after the problem was understood.
That is the fundamental weakness of modern diagnostics. They are frequently designed for someone who already knows the answer.
After decades of progress, we should expect more from our operating systems and enterprise applications. Administrators should not need to conduct a forensic investigation every time a common resource approaches exhaustion or a known failure pattern emerges.
The next great improvement in computing may not be another dashboard, another log platform, or another collection of performance counters.
It may simply be a computer capable of saying, “Here is what is happening. Here is why I believe it is happening. Here is the evidence. And here is where you should look next.”
The computer often already knows what is wrong. It is long past time for it to tell us!